
Percent Change vs Percentage Points: The Difference That Changes Headlines
TLDR
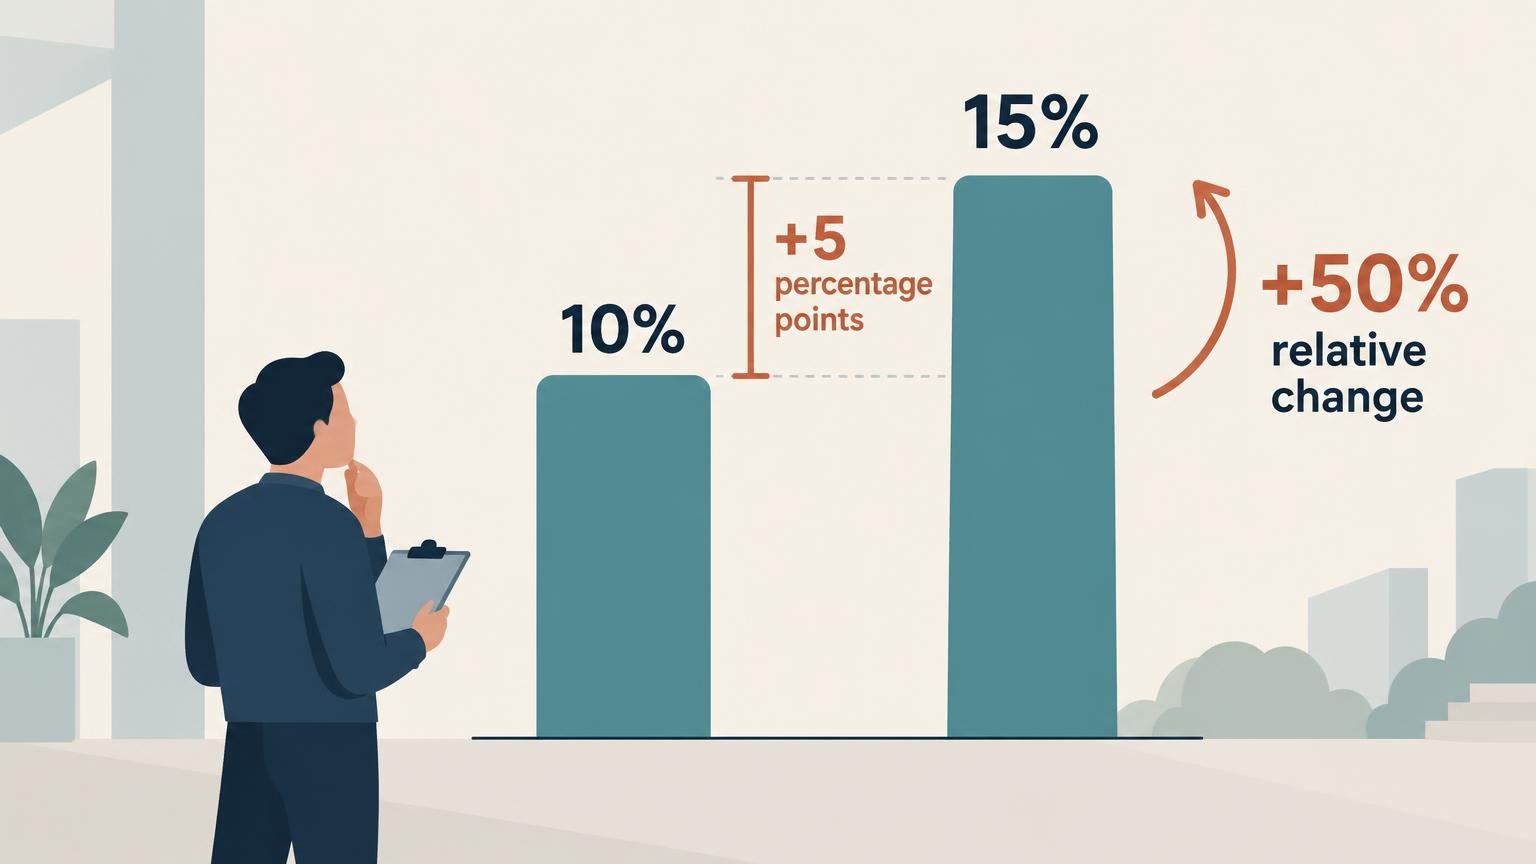
Percentage-point change is the direct subtraction between two percentages. Percent change measures the difference relative to the starting value. If a rate rises from 10% to 15%, it increases by 5 percentage points but by 50% relative to its original level. Both figures are correct, but they answer different questions.
The distinction between percent change vs percentage points can transform the meaning of a headline. A “5% increase” sounds much smaller than a “50% increase,” yet either could be mistakenly attached to the same movement from 10% to 15%. Accurate reporting starts with deciding whether the reader needs the direct movement in a rate or the size of that movement relative to its baseline.
Percent change vs percentage points: the two formulas
The Office for National Statistics defines a percentage point as the difference between two percentages. It illustrates the distinction with a rate falling from 10% to 9%: that is a decline of 1 percentage point, whereas a 1% relative decline from 10% would produce 9.9%. The ONS guidance on percentages and percentage points provides a concise official explanation.
Use these formulas:
- Percentage-point change = new percentage − old percentage
- Relative percent change = ((new value − old value) ÷ old value) × 100
The Bureau of Labor Statistics uses the second formula when calculating changes in the Consumer Price Index: subtract the old index from the new index, divide by the old index and multiply by 100. The BLS percent-change calculation guide shows the calculation with published CPI values.
The quickest rule is therefore: subtract percentages to get percentage points; divide the difference by the original value to get percent change.
Why 10% to 15% is both 5 points and 50%
Consider an illustrative conversion rate that rises from 10% to 15%.
- Percentage-point change: 15% − 10% = 5 percentage points.
- Relative percent change: ((15% − 10%) ÷ 10%) × 100 = 50%.
The 5-point figure tells us how far the rate moved on the percentage scale. The 50% figure compares that movement with the original 10% rate. Because 5 is half of 10, the new rate is 50% higher than the old rate.
Calling this a “5% increase” is normally wrong. A 5% relative increase on a 10% baseline would move the rate to 10.5%, not 15%. The phrase “5% increase” also leaves readers guessing whether the writer meant 5 percentage points or 5% relative.
| Illustrative movement | Percentage-point change | Relative percent change | Clear description |
|---|---|---|---|
| 10% to 15% | +5 points | +50% | Up 5 percentage points, or 50% relative |
| 40% to 45% | +5 points | +12.5% | Up 5 percentage points, or 12.5% relative |
| 50% to 40% | −10 points | −20% | Down 10 percentage points, or 20% relative |
| 2% to 3% | +1 point | +50% | Up 1 percentage point, or 50% relative |
The table shows why the baseline matters. The same 5-point increase represents 50% growth from a 10% starting rate but only 12.5% growth from a 40% starting rate. Conversely, a seemingly small 1-point movement from 2% to 3% is a 50% relative increase.
Which expression should you use?
Use percentage points when describing the direct movement of a rate, share or proportion. Use percent change when explaining how large the movement is relative to the original value. Reporting both is often best when the relative figure could surprise or mislead without the baseline.
- Write “support increased from 42% to 46%, a rise of 4 percentage points.”
- Write “the conversion rate rose from 2% to 3%, an increase of 1 percentage point or 50% relative.”
- Write “market share declined from 25% to 20%, down 5 percentage points or 20% relative.”
- Avoid “the rate increased 5%” when you mean that it moved by 5 percentage points.
Always give the old and new values when space permits. “Up 50%” can sound dramatic, but “up from 2% to 3%” immediately shows the absolute scale. The baseline is not a technical footnote; it is what gives relative change its meaning.
Examples in conversion rates and performance metrics
Suppose a website records 10,000 sessions in each of two periods. Sessions with a key event rise from 300 to 360. The rate increases from 3.0% to 3.6%, assuming the event and session definitions remain unchanged.
- Count change: 60 additional sessions with a key event.
- Rate change: 0.6 percentage points.
- Relative rate change: (0.6 ÷ 3.0) × 100 = 20%.
Google Analytics defines session key-event rate as the percentage of sessions in which a key event occurred. It defines sessions separately using the session_start event. That denominator and metric definition matter: changing the event configuration or the way sessions are counted can create a break in the comparison.
The same discipline applies to other performance measures. If a customer score, defect rate or completion rate changes, identify the calculation before describing the movement. A composite measure may require additional interpretation; for example, Net Promoter Score has properties that differ from an ordinary percentage.
Polling movements belong in percentage points
Poll results are percentages, so their direct movement should usually be reported in percentage points. If measured support moves from 48% to 51%, the descriptive change is 3 percentage points. It is also a 6.25% relative increase, but that expression is less familiar in polling and can exaggerate the apparent importance of a modest point movement.
A reported movement is not automatically evidence that public opinion truly changed. Pew Research Center notes that uncertainty around a comparison between polls can be substantially larger than the margin of error attached to one estimate. Sample design, weighting, field dates, question wording and whether the same respondents were surveyed can all affect interpretation. The distinction is explored further in this guide to what a poll’s margin of error does and does not cover.
A careful sentence separates the observation from the conclusion: “Support was 3 percentage points higher in the later poll.” Whether that reflects a meaningful population change requires the polls’ uncertainty and methodology.
Market share requires a stable market denominator
If a company’s market share rises from 12% to 15%, its share increased by 3 percentage points and by 25% relative to the starting share. Neither figure says that the company’s sales grew by 25%. The total market may also have expanded or contracted.
The Census Bureau illustrates market share as a business’s sales divided by relevant total sales. The result therefore depends on which businesses, products, locations and period define the market. A company can gain share while its sales fall if the total market contracts faster. It can also lose share while increasing sales if competitors grow faster.
Time comparisons become weaker when classifications, establishment definitions, operating-status rules or geographic boundaries change. The Census Bureau identifies these as factors that can affect comparability across periods. Before calculating a change, confirm that both figures use the same market definition. Also distinguish revenue share from unit share, because price and product mix can make them move in different directions.
Inflation involves both index changes and rate changes
Inflation reporting contains two separate comparisons that are easy to confuse. First, statisticians calculate the percent change in a price index. Second, analysts may compare one published inflation rate with another, which produces a percentage-point change in the rate.
For example, BLS reports a CPI-U all-items index of 278.802 for December 2021 and 296.797 for December 2022. Applying the percent-change formula gives about 6.5%: ((296.797 − 278.802) ÷ 278.802) × 100. This is a percent change in an index, not a 6.5-percentage-point change.
If an annual inflation rate later moved from an illustrative 6.5% to 3.5%, the rate would be down 3 percentage points. Relative to 6.5%, that would be a decline of about 46%. Prices could still be rising at 3.5%; the lower inflation rate means the pace of increase slowed, not that the overall price level necessarily fell.
Periods must also match. BLS says an over-the-year CPI change compares the same calendar month in different years. It is not calculated by simply adding the intervening monthly percentage changes. Successive changes compound: each month’s percentage applies to a new index level.
Cases where ordinary percent change breaks down
The starting value is zero
Ordinary percent change is undefined when the starting value is zero because the formula requires division by zero. If events increase from zero to five, report the absolute increase, the new count and the relevant denominator. Do not describe it as an infinite or arbitrarily large percentage increase.
The baseline is negative
Negative baselines can produce mathematically computable but counterintuitive results. A financial result improving from −$10 million to −$5 million gives −50% under the standard formula because the denominator is negative, even though the loss was cut in half. Report the dollar improvement and describe the loss as halving instead of relying on the signed percentage alone.
The denominator or definition changed
A calculation can be arithmetically correct and still provide a poor comparison. If one rate covers registered users and another covers active users, subtracting or dividing them does not repair the denominator mismatch. Use the same population, market, period and metric definition on both sides.
Common reporting mistakes
- Using percent and percentage points as interchangeable terms.
- Reporting a relative change without the starting and ending values.
- Using a large relative increase to sensationalize movement from a very small baseline.
- Treating a point movement in a poll as proof of a real shift without considering uncertainty.
- Describing market-share growth without defining the market or confirming a stable denominator.
- Adding monthly percentage changes instead of compounding them.
- Calculating ordinary percent change from a zero baseline.
- Using “percentage difference” without defining the formula.
“Percentage difference” is especially ambiguous. It sometimes means percent change from an old value, but it can also mean the absolute difference divided by the average of two values—a symmetric formula used when neither value is the baseline. Name the exact measure instead: percentage-point change, percent change from the baseline or percentage difference using a stated formula.
A reporting checklist
- State the old value and the new value.
- Identify whether the values are counts, index levels, rates or shares.
- For two percentages, subtract to calculate the percentage-point movement.
- Divide the difference by the old value only when relative percent change is useful and the baseline is nonzero.
- Keep the time period, numerator, denominator, population and metric definition consistent.
- Report both point and relative change when each adds useful context.
- For polls and estimates, check uncertainty before calling the movement meaningful.
- Use plain wording such as “up 3 percentage points, from 12% to 15%.”
Frequently asked questions
Can percentage-point change and percent change both be correct?
Yes. A rise from 20% to 25% is an increase of 5 percentage points and a 25% relative increase. The first measures direct movement on the percentage scale; the second measures that movement relative to the 20% baseline.
Should conversion-rate improvements use percent or percentage points?
Use percentage points for the direct change and consider adding relative percent change. “Conversion rose from 4% to 5%, up 1 percentage point or 25% relative” is clear and complete.
What should I report when the starting value is zero?
Report the absolute change and the underlying values. Ordinary percent change cannot be calculated because zero cannot be used as the denominator.
Is a change in inflation measured in percentage points?
It depends on what is changing. The movement in a price index over a period is a percent change. The difference between two inflation rates is a percentage-point change.
The practical takeaway
When comparing two percentages, start by subtracting them and report the result in percentage points. If readers also need to know how large that movement was relative to the baseline, divide by the original rate and report percent change. Give both endpoints, keep the denominator consistent and avoid relative-change calculations when the baseline is zero. That small amount of context prevents the arithmetic from changing the headline’s meaning.
References
- Percentages and percentage points – Content style guide – Service manual – Office for National Statistics
- Calculating percent changes : U.S. Bureau of Labor Statistics
- API dimensions and metrics | Google Analytics | Google for Developers
- Understanding the margin of error in election polls | Pew Research Center
- How 2012 Economic Census Data Are Used
- Statistics of U.S. Businesses Methodology