Cost of Downtime: How to Put a Dollar Value on Equipment Being Offline
A defensible downtime estimate separates lost contribution from labor, recovery, quality and customer costs—and counts only consequences the outage actually caused.


A defensible downtime estimate separates lost contribution from labor, recovery, quality and customer costs—and counts only consequences the outage actually caused.

A simple average treats every observation equally. A weighted average gives more influence to observations representing more money, units, people or another relevant share.

The choice between a bar chart and a line chart depends on the question: compare discrete categories with bars and show change across an ordered scale with lines.

Fixed cost per unit usually falls as output rises, but capacity thresholds can reset the calculation. Contribution margin and break-even analysis reveal when scale actually improves unit economics.

Learn how to normalize prices by ounce, count, or square foot—and how to recognize when a mathematically correct unit price still gives an incomplete comparison.

A record revenue figure does not necessarily represent record economic activity. Learn how to calculate inflation-adjusted growth and choose an appropriate price index.
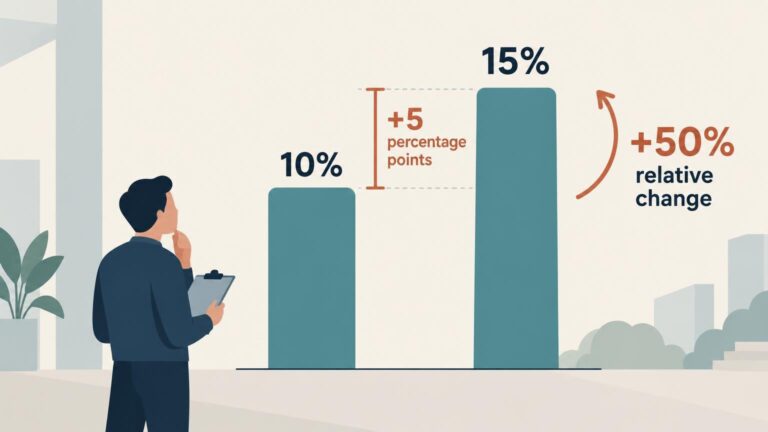
Percentage points measure the direct difference between percentages. Percent change measures that difference relative to the starting value. Here is how to calculate and report both correctly.

The mean captures total spending per purchase, while the median identifies the midpoint of a sorted price distribution. Here is how to calculate both and decide which better represents a market.

Stacked area charts show how a total and its composition change over time, but moving baselines make most individual categories difficult to compare precisely.

Use a pie chart for a small, clearly differentiated composition of one meaningful whole. Use a bar chart when readers need to compare, rank, or distinguish similar values.

A confidence interval describes uncertainty about an average, expected value, or parameter. A prediction interval describes uncertainty around a new individual outcome—and is usually much wider.

A survey’s margin of error describes sampling uncertainty, not total accuracy. Here is how to evaluate the errors and design choices hidden behind the ± figure.